Effect of uncertainty visualizations on myopic loss aversion and the equity premium puzzle in retirement investment decisions
Effect of uncertainty visualizations on myopic loss aversion and the equity premium puzzle in retirement investment decisions
Abstract
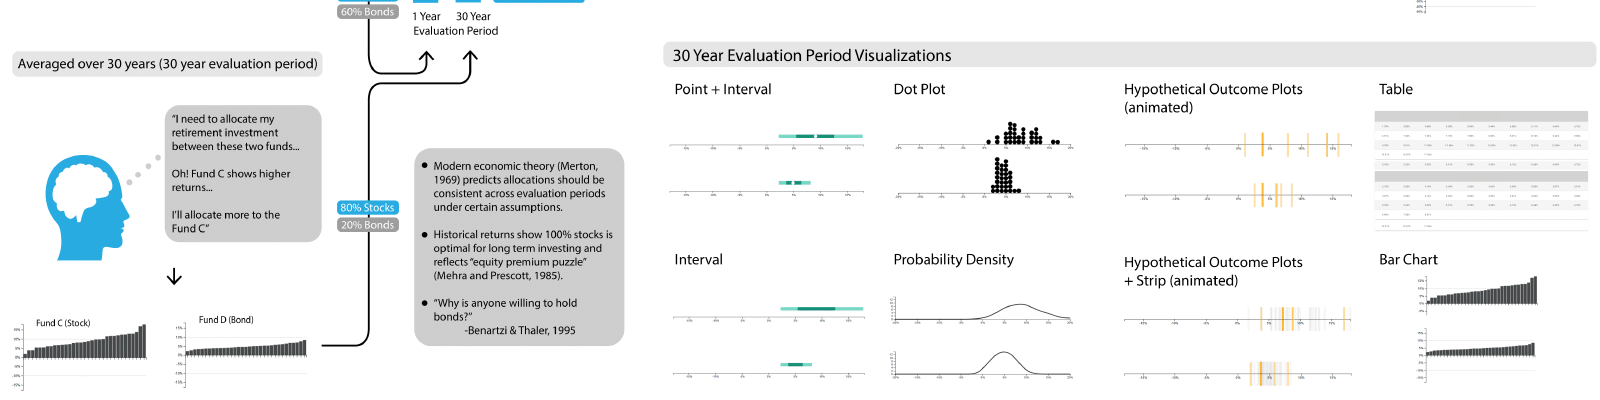
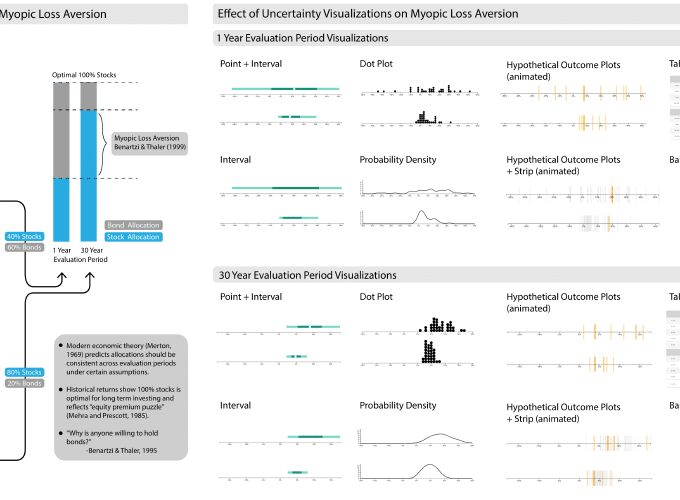
For many households, investing for retirement is one of the most significant decisions and is fraught with uncertainty. In a classic study in behavioral economics, Benartzi and Thaler (1999) found evidence using bar charts that investors exhibit myopic loss aversion in retirement decisions: Investors overly focus on the potential for short-term losses, leading them to invest less in riskier assets and miss out on higher long-term returns. Recently, advances in uncertainty visualizations have shown improvements in decision-making under uncertainty in a variety of tasks. In this paper, we conduct a controlled and incentivized crowdsourced experiment replicating Benartzi and Thaler (1999) and extending it to measure the effect of different uncertainty representations on myopic loss aversion. Consistent with the original study, we find evidence of myopic loss aversion with bar charts and find that participants make better investment decisions with longer evaluation periods. We also find that common uncertainty representations such as interval plots and bar charts achieve the highest mean expected returns while other uncertainty visualizations lead to poorer long-term performance and strong effects on the equity premium. Qualitative feedback further suggests that different uncertainty representations lead to visual reasoning heuristics that can either mitigate or encourage a focus on potential short-term losses. We discuss implications of our results on using uncertainty visualizations for retirement decisions in practice and possible extensions for future work.