Du Bois Wrapped Bar Chart: Visualizing Categorical Data with Disproportionate Values
Du Bois Wrapped Bar Chart: Visualizing Categorical Data with Disproportionate Values
Abstract
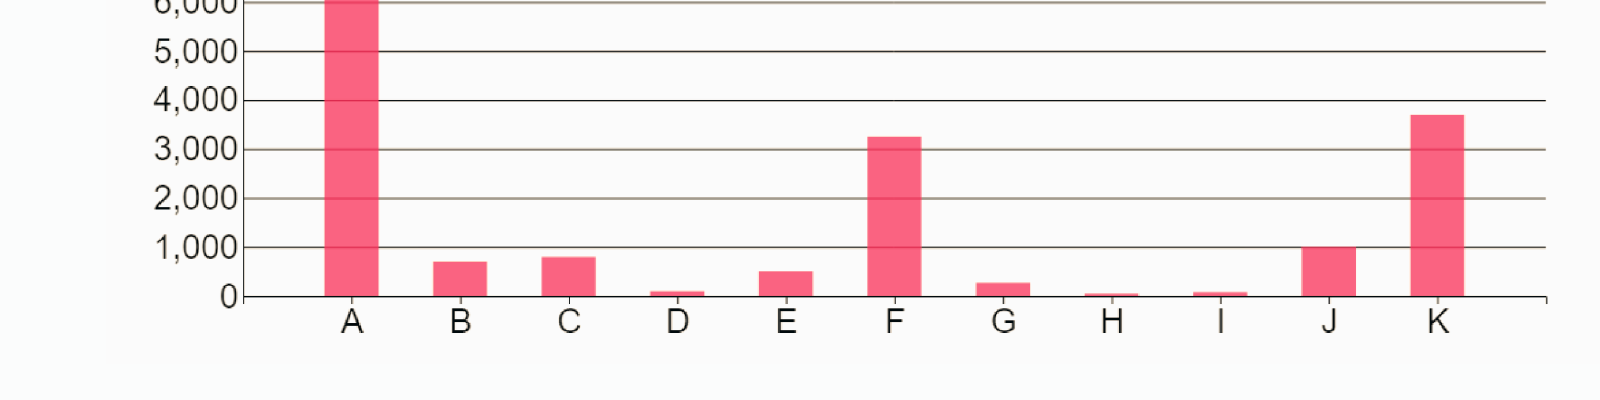
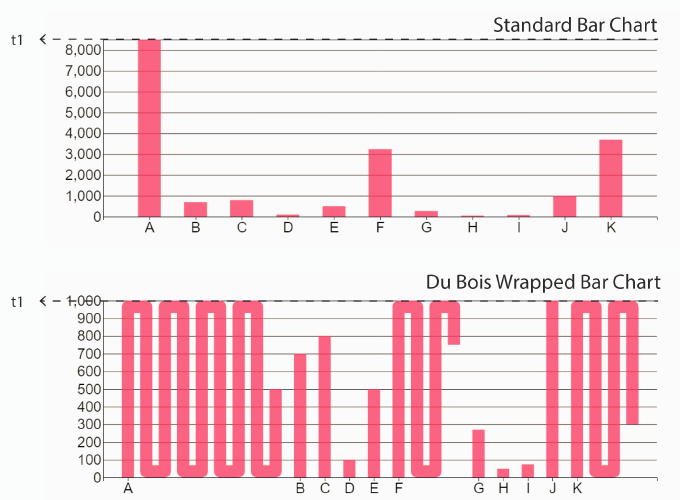
We propose a visualization technique, Du Bois wrapped bar chart, inspired by work of W.E.B Du Bois. Du Bois wrapped bar charts enable better large-to-small bar comparison by wrapping large bars over a certain threshold. We first present two crowdsourcing experiments comparing wrapped and standard bar charts to evaluate (1) the benefit of wrapped bars in helping participants identify and compare values; (2) the characteristics of data most suitable for wrapped bars. In the first study (n=98) using real-world datasets, we find that wrapped bar charts lead to higher accuracy in identifying and estimating ratios between bars. In a follow-up study (n=190) with 13 simulated datasets, we find participants were consistently more accurate with wrapped bar charts when certain category values are disproportionate as measured by entropy and H-spread. Finally, in an in-lab study, we investigate participants’ experience and strategies, leading to guidelines for when and how to use wrapped bar charts.